M1: Efficient LiDAR Ingestion in C++
Taming Raw LiDAR Data: RELLIS-3D Ingestion
The first challenge in building a perception stack for off-road environments is data ingestion. For Terra Perceive, I selected the RELLIS-3D dataset. Unlike typical highway datasets, RELLIS-3D captures unstructured terrain—mud, steep grades, and tall grass—which provides a rigorous test for perception algorithms.
This milestone focuses on the development of a high-performance C++ loader capable of handling the high data rates of an Ouster OS1-64 LiDAR sensor while ensuring the data is mathematically valid before it reaches the core algorithms.
Data Format & Coordinate Frames
The RELLIS-3D data is stored in the KITTI-style binary format. Each point is represented by four float32 values packed contiguously in memory: [x, y, z, intensity].
- Storage: Each point occupies 16 bytes (( 4 \times 4 ) bytes).
- Coordinate System: We operate in the standard ROS-style Right-Handed System where X is Forward, Y is Left, and Z is Up.
Technical Implementation: ( O(N) ) Ingestion
The goal of the loader is to achieve single-pass, ( O(N) ) efficiency with minimal memory overhead. I implemented this in src/point_cloud_loader.cpp and include/point_cloud_loader.hpp.
Memory Efficiency & Pre-allocation
To prevent performance degradation caused by repeated memory reallocations in a standard std::vector, the loader calculates the exact memory required before starting the ingestion loop.
By using points.reserve(N), we allocate the heap memory once, ensuring the read operation remains linear and fast.
Binary I/O Logic
The loader uses std::ifstream in binary mode (std::ios::binary) to prevent raw byte corruption. We extract the geometric x, y, z coordinates into an Eigen::Vector3f and explicitly skip the intensity field for this initial geometry-only phase.
Verification: Visual Sanity Checks
To verify the C++ loader, I developed a Python-based visualization tool, scripts/visualize_pointcloud.py. Using the Open3D library, this script colors the point cloud by height (Z-value), allowing for immediate visual confirmation of the loader’s output.
If the visualization shows a coherent 3D scene with the ground plane correctly oriented, we can proceed with confidence to the next stage: RANSAC ground segmentation.
Results
On a typical RELLIS-3D frame (131,072 points), the loader yielded:
- X (Forward): [-49.6m, 91.2m]
- Y (Lateral): [-58.6m, 58.2m]
- Z (Up): [-3.4m, 7.3m]
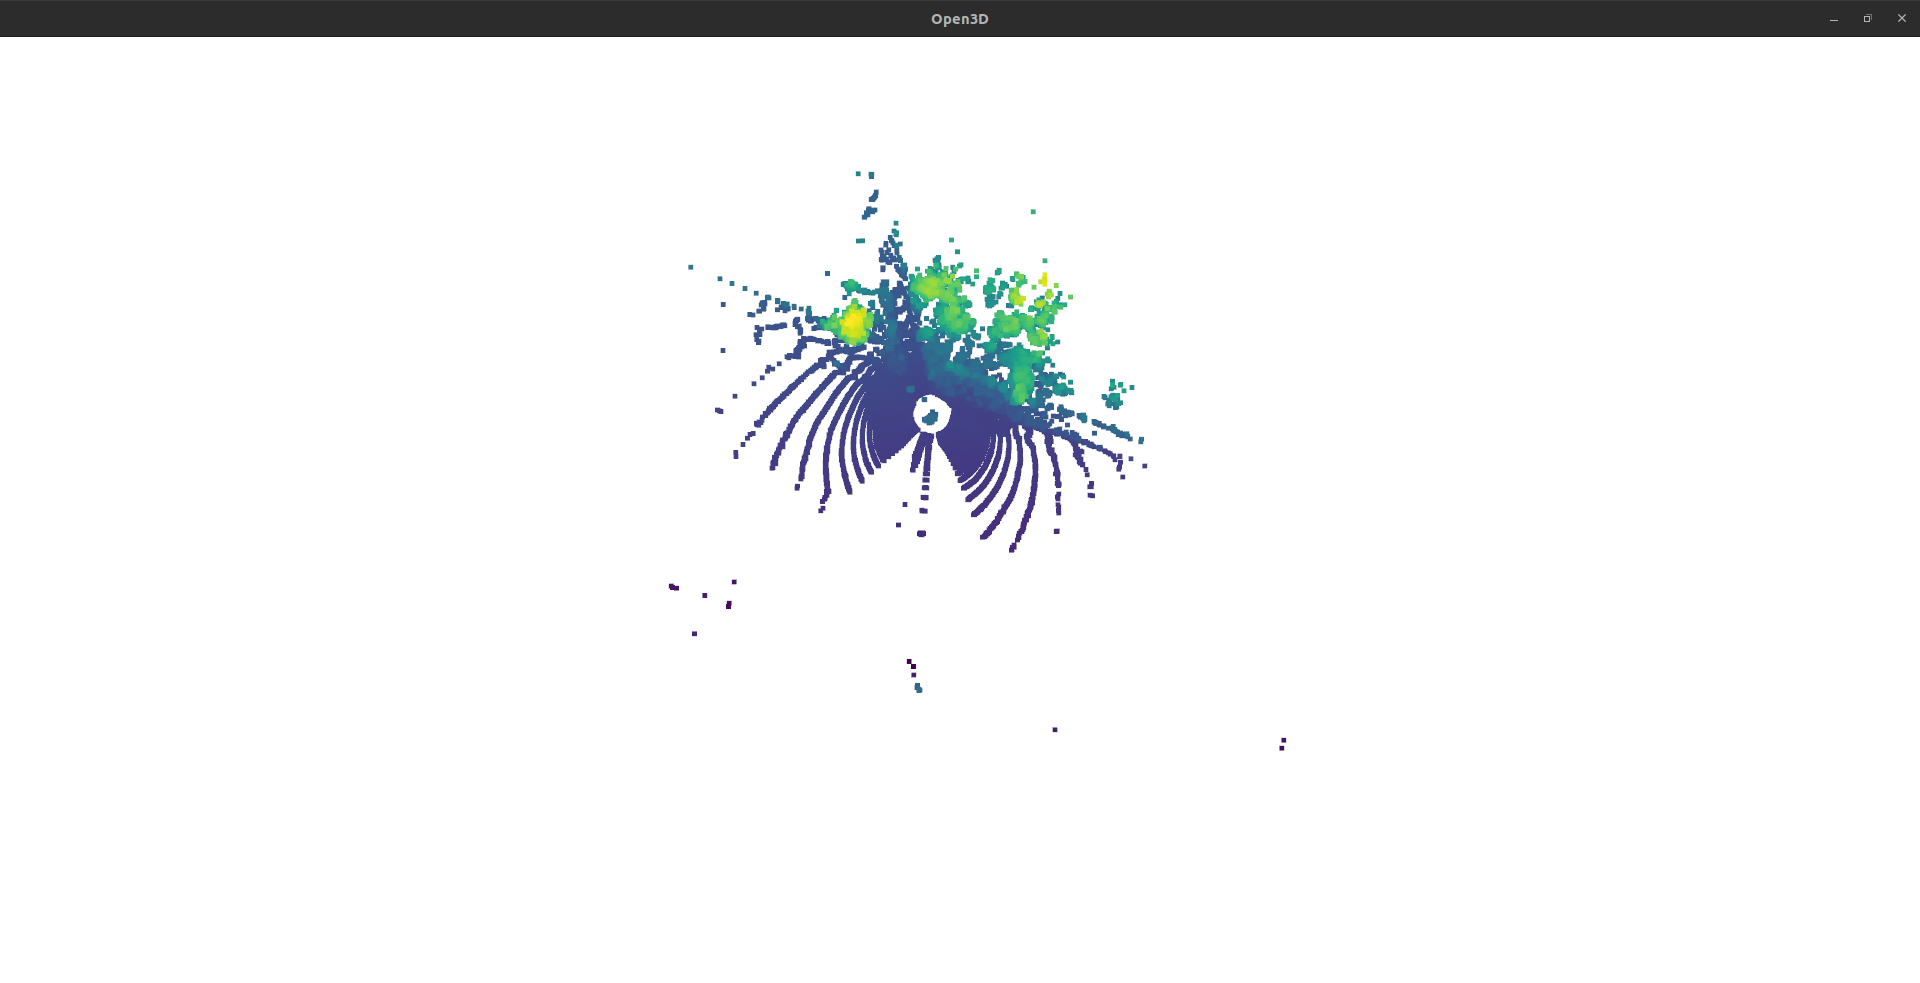 Figure 1: Verified point cloud visualization of a RELLIS-3D frame.
Lessons Learned & Future Hardening
During development, I initially relied on simple sys.argv for script arguments. This proved brittle and lacked documentation. Moving to the argparse library provided a professional CLI interface and better error handling.
Furthermore, relying on std::cerr for error reporting is sufficient for a prototype, but for the next phase, I plan to integrate a more robust logging framework (like spdlog) to support different severity levels and structured reporting.
Next Step: Milestone 2: Sector-based RANSAC for Sloped Terrain